Your One Stop Source For Tropical Weather Information
If The Site Doesn't Appear To Be Updated, Please Click Refresh!
Atlantic - Caribbean Sea - Gulf of Mexico
Current Atlantic Basin Information
Tropical Atlantic Satellite Images
| Infared (Rainbow) Satellite Image Courtesy of the Satellite Services Division of the National Environmental Satellite, Data, and Information Service (NESDIS): |

| Infared (ShortWave) Satellite Image Courtesy of the Satellite Services Division of the National Environmental Satellite, Data, and Information Service (NESDIS): |

| Water Vapor Satellite Image Courtesy of the Satellite Services Division of the National Environmental Satellite, Data, and Information Service (NESDIS): |

| Visible Satellite Image Courtesy of the Satellite Services Division of the National Environmental Satellite, Data, and Information Service (NESDIS): |

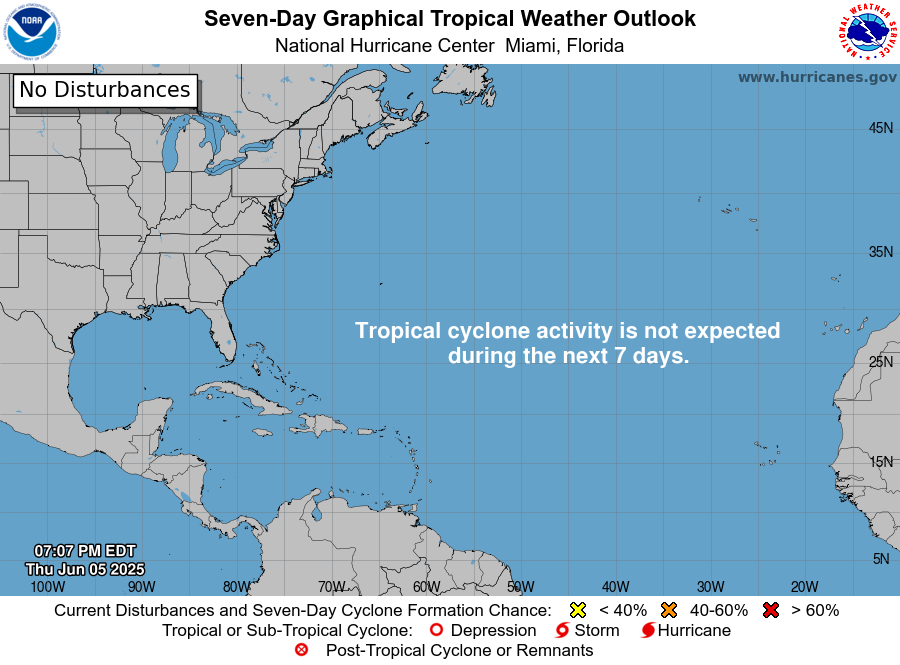
Tropical Weather Outlook and Discussion
| Graphical Tropical Weather Outlook Courtesy of National Hurricane Center: |
| Latest
Tropical Weather Outlook Courtesy of the National Hurricane Center: |
| Latest
Tropical Weather Discussion Courtesy of the National Hurricane Center: |
| Mariner's 1-2-3 Day Rule (Potential Tropical Formation) Courtesy of the National Hurricane Center: |
| Probability Of Tropical Cyclone Formation
Within 24 Hours Courtesy of Satellite Services Division of the National Environmental Satellite, Data, and Information Service (NESDIS): |
| Tropical Atlantic Surface Analysis Courtesy of the National Hurricane Center: |
| Tropical Atlantic Surface Analysis Courtesy of the National Hurricane Center: |
| Tropical Atlantic Surface Analysis Courtesy of the University of Miami (Ocean Prediction Center): |

| Tropical Atlantic Surface Analysis Courtesy of the Naval Meteorology & Oceanography Command : |

Caribbean Sea & Gulf of Mexico Recent Marine Data
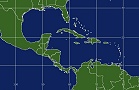
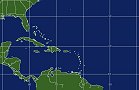
| Caribbean Sea Recent Marine Data Courtesy of the NOAA's National Data Buoy Center*: |
To view marine data, click a station on the map below:

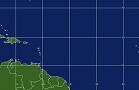
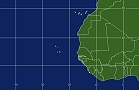
| Western Caribbean Recent Marine Data Courtesy of the NOAA's National Data Buoy Center*: |
To view marine data, click a station on the map below:

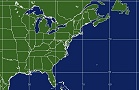
| Western Gulf of Mexico Recent Marine Data Courtesy of the NOAA's National Data Buoy Center*: |
|
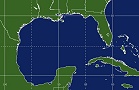
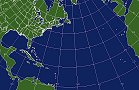
| Florida and Eastern Gulf of Mexico Recent Marine Data Courtesy of the NOAA's National Data Buoy Center*: |
To view marine data, click a station on the map below:

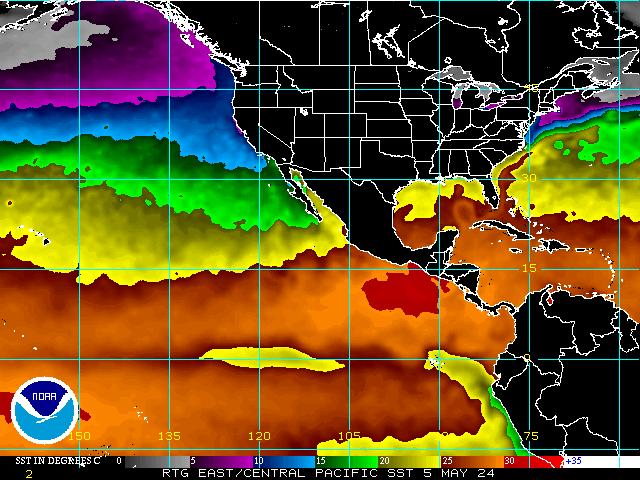
Sea Surface Temperature & Wind Analysis
| Current
Sea Surface Temperature Analysis Courtesy of the National Hurricane Center: |
| Atlantic
Sea Surface Temperature Analysis Courtesy of Weather Underground: |
![]()
| Atlantic Composite 5 Day
Sea Surface Temperature Analysis Courtesy of the National Weather Service (Ocean Prediction Center): |

| Current Atlantic
Sea Surface Temperatures Courtesy of the National Hurricane Center: |

| Current
Atlantic 700-850 mb Mean Wind Analysis (TC Sfc Pressure
Range 1000-1010 mbs) Courtesy of the University of Wisconsin- Cooperative Institute for Meteorological Satellite Studies (CIMSS): |
| Current
Atlantic 500-850 mb Mean Wind Analysis (TC Sfc Pressure
Range 990-999 mbs) Courtesy of the University of Wisconsin- Cooperative Institute for Meteorological Satellite Studies (CIMSS) |
| Current
Atlantic 850 mb Relative Vorticity Analysis Courtesy of the University of Wisconsin- Cooperative Institute for Meteorological Satellite Studies (CIMSS): |
| Current
Atlantic Wind Shear Analysis Courtesy of the University of Wisconsin- Cooperative Institute for Meteorological Satellite Studies (CIMSS): |
| Current
Atlantic Wind Shear Analysis Courtesy of the University of Wisconsin- Cooperative Institute for Meteorological Satellite Studies (CIMSS): |
| Current
Atlantic Sea State Analysis Courtesy of the National Hurricane Center: |

Atlantic and Caribbean Tropical Satellite Imagery
| The Following Information (Links, Images, & Satellite Imagery) Is Hotlinked Directly From The Satellite Services Division of the National Environmental Satellite, Data, and Information Service (NESDIS) : |
All Floaters Quick-Link |
Storm Floater 1
|
Storm Floater 2
|
Storm Floater 3
|
Storm Floater 4
|
|
|
|
RTG-SST Sea Surface Temperatures |
Polar Image Composites |
Other Floaters |
||
| Image | Atlantic | Pacific | ||
| Loop | Atlantic | Pacific | ||
Loop Note:
Short - usually 8 images limited overlays
Long - usually 12-15 images many overlays
All Loops have a Lat/Lon Overlay
Link to All Floater Imagery
Tropical Storms & Hurricanes of the 2025 Atlantic Hurricane Season
| 2025
Tropical Storm & Hurricane Tracks Courtesy of Weather Underground: |

| 2025 Atlantic Basin Tropical Cyclone Names: |
| Andrea | Barry | Chantal | Dexter | Erin |
| Fernand | Gabrielle | Humberto | Imelda | Jerry |
| Karen | Lorenzo | Melissa | Nestor | Olga |
| Pablo | Rebekah | Sabastien | Tanya | Van |
| Wendy |
| The following hyperlinks are Courtesy of the Central Florida Hurricane Center: |
![]()
